|
||
| Products Download Events Support Videos | ||

Technical Support
On-Line Manuals
µVision User's Guide
Event Viewer
The Event Viewer displays thread, interrupt, and exception execution over time. To display the timing information it uses trace information generated by Cortex-M3, M4, M7 devices and requires a suitable debug adapter, for example ULINKpro.
Prerequisites for using the Event Viewer
-
Configure the target as described in
- Configure Cortex-M Devices for Tracing when using an ULINKPro debugger adapter.
- Configure Cortex-M Devices for Tracing when using an ULINK2 debugger adapter.
- Configure Cortex-M Devices for Tracing when using an J-Link/J-Trace debugger adapter.
-
Using the Trace Configuration dialog of these adapters
you should configure the following:
- Enable Timestamps to obtain timing information.
- To display thread switches, enable ITM Stimulus Port 31.
- To display interrupts and exceptions, enable Trace Events - EXCTRC: Exception Tracing.
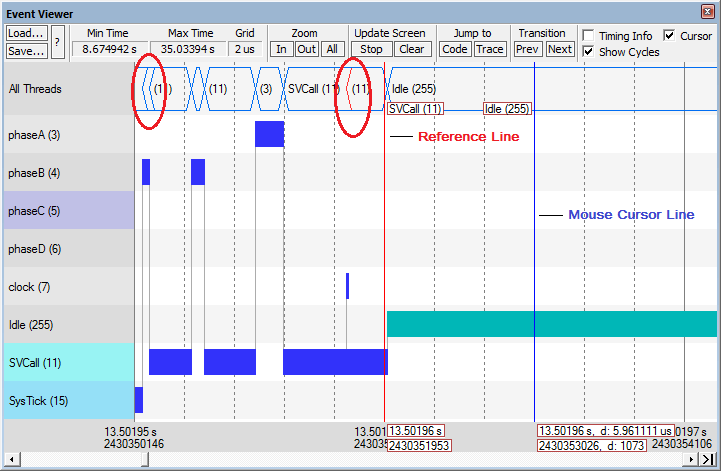
Open the window with Debug - OS Support - Event Viewer.
Where
- Thread and exception names (with IDs) are displayed on the left side of the window. Threads have alternating gray, and exceptions have alternating blue colors. The highlighted entry is enabled for navigation with keyboard keys. Selecting All Threads allows you to navigate over all threads and exceptions.
- The time range is displayed on the bottom border of the window.
Load... imports the thread- and exception-switching history previously saved in a file (*.UVTSK). Data can be analyzed off-line.
Save... stores the thread- and exception-switching history in a file (*.UVTSK) for future analysis.
? opens this help.
Time fields show:
- Min Time is the first timestamp of the recording buffer. The time starts at zero and keeps rolling forward while µVision records the threads.
- Max Time is the last timestamp of the recording buffer. It shows the time past since signal recording started.
- Grid is the time interval between two grid lines.
Zoom buttons change the time scale:
- In zooms into the threads to get a detailed view at the Reference Line. The time interval between two grid lines gets smaller.
- Out zooms out of the signals for a better overview at the Reference Line. The time interval between two grid lines gets larger.
- All shows the complete content of the recording buffer.
Update Screen buttons control the screen output.
- Stop freezes the data of the graphical display. µVision continues filling the recording buffer. When clicked, the button changes its boilerplate text to Start.
- Start unfreezes the graphical display. The data of the recording buffer and the incoming data are shown. When clicked, the button changes its boilerplate text to Stop.
- Clear empties the recording buffer and clears the Event Viewer display area.
Jump to buttons synchronize the event with:
- Code opens the disassembly or source code window at the code line where the thread starts.
- Trace opens the windows Trace Data and the Trace Navigation. Data get synchronized between the windows.
Transition buttons snap the Reference Line to the next transition point. Highlight a thread name and click:
- Prev to move the Reference Line to the previous transition point, or press the Left-Arrow key.
- Next to move the Reference Line to the succeeding transition point, or press the Right-Arrow key.
Checkboxes
- Cursor enables a Mouse Cursor Line, which moves with the mouse. Mouse position data and deltas to the Reference Line are displayed on the timestamp axis.
- Show Cycles enables cycle information, which are displayed on the timestamp axis.
-
Timing Info enables event details while hovering the mouse
over an event transition.
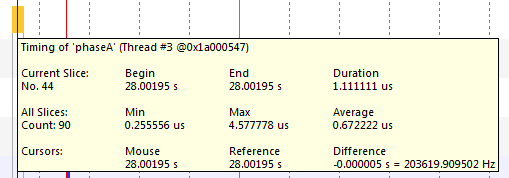
The tooltip shows timing information based on the slice you have selected. At the top, it shows the name and ID of the thread or exception. Thread information is extended with the start address.
Current Slice shows the slice number, based on the event count and on the beginning of the viewable buffer. No. 44 in the picture is the 44th slice of the thread phaseA relative to the start of the viewable buffer. The first viewable slice has always the number one. The slice starts at Begin seconds, lasts until End seconds, and has the Duration of micro seconds. This line is not displayed when hovered over a free space.
All Slices shows the total amount of viewable time slices. The slices have a minimum duration of Min, maximum duration of Max, and an average duration of Average.
Cursors information are shown for the mouse and Reference Line. When the Reference Line has been set, the tooltip shows the time difference between the Reference Line position and mouse position in seconds and frequency (Hz).
All Threads graph
The All Threads graph shows event-switching occurrences with a blue X.
Blue opening brackets < (left red circle in the picture) indicate event-switching occurrences that cannot be resolved on the graphical scale. You can zoom-in at those points to view detailed event switches.
The red opening bracket < (right red circle in the picture) indicates event-switching occurrences that cannot be resolved on the graphical and time scale. Zooming in at those points will not deliver details on the time scale. The events are shown as if occurred at the same time. This is due to lack of timing information. Select a smaller number for Timestamps Prescaler in Options for Target - Debug - Settings - Trace.
Additional mouse and key commands
- One mouse click into the display area sets the Reference Line.
- A double-click into the display area switches off the Reference Line.
- The mouse wheel zooms in and out at mouse position.
- Shift+mouse move snaps the Mouse Cursor Line to the next or previous transition point of the thread to which the mouse is pointing. The transition point has to be visible in the window.
- Press the Up- and Down-Arrow keys to highlight the next thread.
- A double-click on a thread or interrupt name changes the graphic shape.
- HOME jumps to the start of recording.
- END jumps to the end of recording and locks Scrollbar (newest records always shown).
ProductsDevelopment Tools |
Hardware & Collateral |
Downloads |
Support |
Contact |