|
||
| Products Download Events Support Videos | ||

Technical Support
On-Line Manuals
µVision User's Guide
Status Bar
The Status Bar displays information and messages about the current µVision command. The Status Bar is located at the bottom of the µVision screen and must be enabled through the menu View - Status Bar.
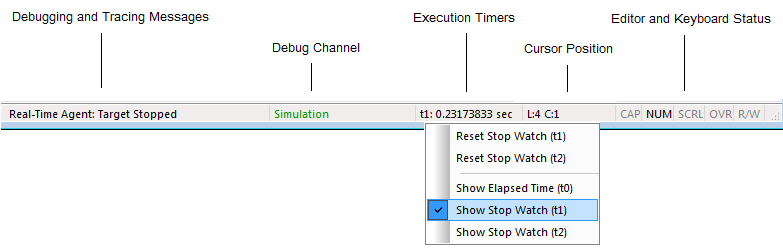
The following message types are displayed:
Debugging and Tracing Messages depend on the debug adapter in use and are described in Trace Status of the ULINK2 User's Guide.
Debug Channel is active debug adapter. Can be the name of the AGDI Debug Driver or Simulation when debugging with the Simulator.
Execution Timers display time information. Hover the mouse over the field to view all available timers. Right click on the field to switch to or reset a timer. Execution Timers are reset the following way:
- Simulator: All Execution Timer values are reset upon CPU RESET.
Cursor Position shows the cursor position in the current editor file (L: line number, C: column number).
Editor and Keyboard Status:
- CAP: keyboard is in Caps-Lock status.
- NUM: keyboard is in Num-Lock status.
- SCRL: keyboard is in Scroll-Lock status.
- OVR: keyboard is in over-type mode overwriting characters while typing.
- R/W or R/O: current editor file attribute. R/W full read/write access. R/O read-only access preventing text modifications.
ProductsDevelopment Tools |
Hardware & Collateral |
Downloads |
Support |
Contact |