|
||
| Products Download Events Support Videos | ||

Technical Support
On-Line Manuals
µVision3 User's Guide
Start Debugging
![]() The µVision3 Debug Mode starts with the menu
command Debug — Start/Stop Debug Session. Depending on
settings under Options for Target —
Debug, the µVision3 Debugger loads the application program
and executes the startup code.
The µVision3 Debug Mode starts with the menu
command Debug — Start/Stop Debug Session. Depending on
settings under Options for Target —
Debug, the µVision3 Debugger loads the application program
and executes the startup code.
µVision3 saves the editor screen layout and restores the screen layout of the last debug session. If the program execution stops, µVision3 opens an editor window with the source text or shows CPU instructions in the disassembly window.
![]() The current instruction or high-level
statement (the one about to execute) is marked with a yellow arrow.
Each time you step, the arrow moves to reflect the new current line
or instruction.
The current instruction or high-level
statement (the one about to execute) is marked with a yellow arrow.
Each time you step, the arrow moves to reflect the new current line
or instruction.
The following screen is what you can expect when you start the debugger.
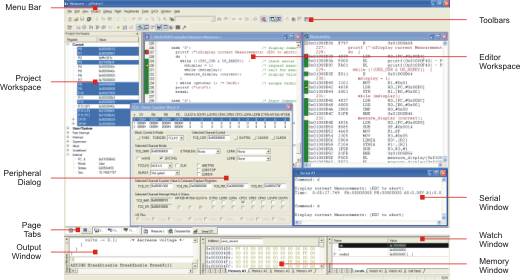
During debugging, most editor features are still available. For example, you can use the find command or correct program errors. Program source text of your application is shown in the same windows.
The µVision3 debug mode differs from the edit mode in the following aspects:
- The Debug Menu and Debug Commands are available. The additional Debug Windows and Dialogs are discussed in the following.
- The project structure or tool parameters cannot be modified. All build commands are disabled.
ProductsDevelopment Tools |
Hardware & Collateral |
Downloads |
Support |
Contact |