|
||
| Products Download Events Support Videos | ||
Technical Support
On-Line Manuals
µVision3 User's Guide
Disassembly Window
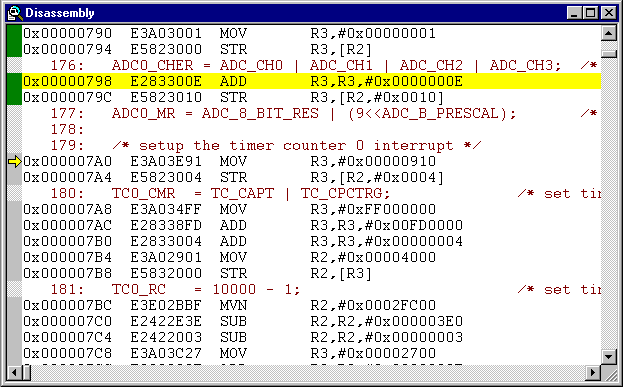
![]() The Disassembly window shows your target
program as mixed source and assembly program or just assembly code. A
trace history of previously executed instructions may be displayed
with Debug — View Trace Records. To enable the trace history,
set Debug — Enable/Disable Trace Recording.
The Disassembly window shows your target
program as mixed source and assembly program or just assembly code. A
trace history of previously executed instructions may be displayed
with Debug — View Trace Records. To enable the trace history,
set Debug — Enable/Disable Trace Recording.

If you select the Disassembly Window as the active window all program step commands work on CPU instruction level rather than program source lines. You can select a text line and set or modify code breakpoints using toolbar buttons or the context menu commands.
You may use the dialog Debug — Inline Assembly... to modify the CPU instructions. That allows you to correct mistakes or to make temporary changes to the target program you are debugging.
ProductsDevelopment Tools |
Hardware & Collateral |
Downloads |
Support |
Contact |
