|
||
| Products Download Events Support Videos | ||
Technical Support
On-Line Manuals
µVision3 User's Guide
Execution Profiler
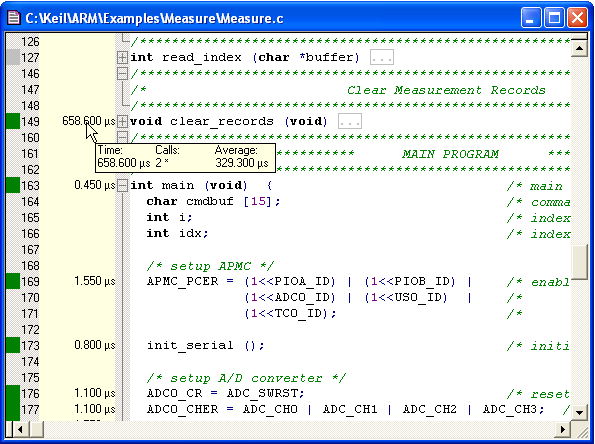
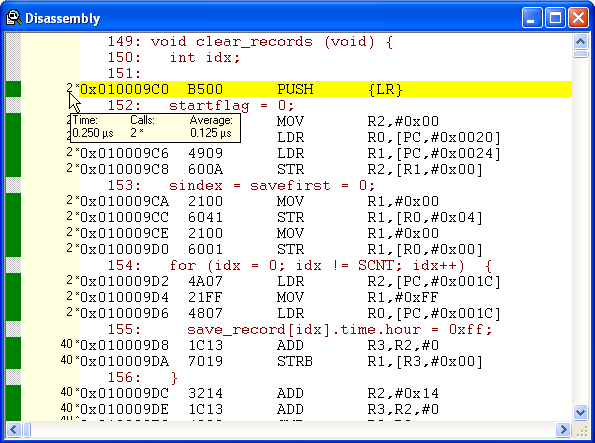
The µVision ARM simulator contains an Execution Profiler that records timing statistics for the complete program code. The display is enabled via the menu command Debug — Execution Profiling. You may select between Call (shows number of executions) and Time (shows execution timing) display. Point with the mouse to a specific entry for complete information display in a tool tip window.

View in C Source Files. By using the editor Source Outlining features, you may collapse several source code lines to get a summarize of the execution times of this source block.

View in the disassembly window gives execution statistics for single assembler instructions.
Note
- The execution time is calculated based on the current clock setting. When the code is executed multiple times using different execution clock values, wrong execution time results are generated.
- The Exection Profiler is currently only available in the ARM simulator.
ProductsDevelopment Tools |
Hardware & Collateral |
Downloads |
Support |
Contact |
