|
||
| Products Download Events Support Videos | ||

Technical Support
On-Line Manuals
µVision3 User's Guide
Performance Analyzer
![]() The µVision3 Performance
Analyzer displays the execution time recorded. The µVision ARM
simulator records timing statistics for the complete program code.
Other µVision simulators (8051, 251, 166) record execution time for
functions and address ranges you specify.
The µVision3 Performance
Analyzer displays the execution time recorded. The µVision ARM
simulator records timing statistics for the complete program code.
Other µVision simulators (8051, 251, 166) record execution time for
functions and address ranges you specify.
Display for the ARM Architectures
The µVision ARM simulator displays the information collected by the Execution Profiler for known address ranges. The display list does not include information for address ranges without debug information (such as the floating point library of the ARM ADS/RealView toolset).
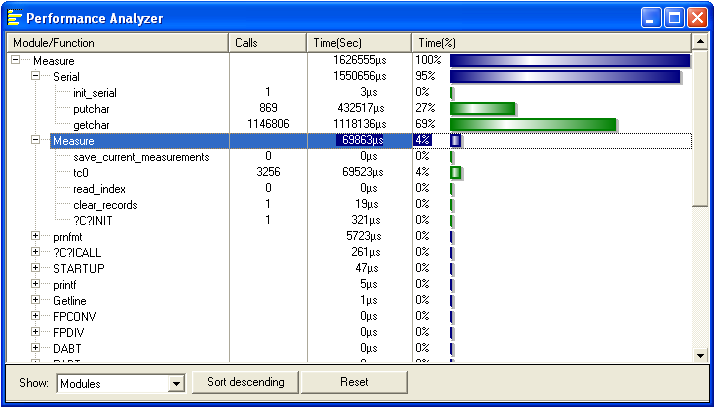
Show allows you to select a Module or Function list. Sort descending sorts the list for maximum execution times. Reset clears the current time recordings.
Results display as bar graphs along with call and time information as described in the following table.
| Label | Description |
|---|---|
| Module/Function | The name of the module or function. |
| Calls | The number of calls to a function. |
| Time(Sec) | The total time spent in the address range of the function or module. |
| Time(%) | The percent of the total time spent in the selected address range or function. |
Display for other Architectures
Other architectures (8051, 251, or 166) require to setup the Performance Analyzer with the menu command Debug — Performance Analyzer or the PA command in the command window. You need to specify functions or address ranges for recording.
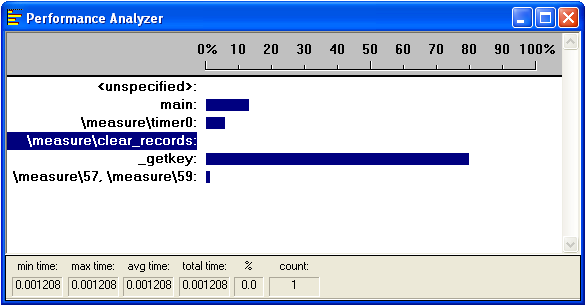
The <unspecified> address range is automatically generated. It shows the amount of time spent executing code that is not included in the specified functions or address ranges.
Results display as bar graphs. Information such as invocation count, minimum time, maximum time, and average time is displayed for the selected function or address range. Each of these statistics is described in the following table.
| Label | Description |
|---|---|
| min time | The minimum time spent in the selected address range or function. |
| max time | The maximum time spent in the selected address range or function. |
| avg time | The average time spent in the selected address range or function. |
| total time | The total time spent in the selected address range or function. |
| % | The percent of the total time spent in the selected address range or function. |
| count | The total number of times the selected address range or function was executed. |
ProductsDevelopment Tools |
Hardware & Collateral |
Downloads |
Support |
Contact |