|
||
| Products Download Events Support Videos | ||

Technical Support
On-Line Manuals
µVision User's Guide


 Debugging
This chapter describes the debug modes of µVision and the user interface for testing applications.
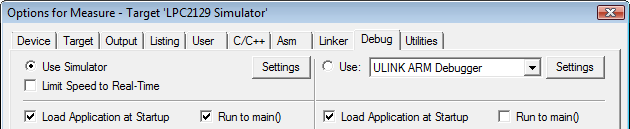
Two debugging modes can be selected and configured in the dialog Options for Target — Debug:
- Use Simulator, configures the µVision Debugger as software-only product that simulates most features of a microcontroller. Developers can test and debug embedded applications before the hardware is ready. µVision simulates a wide variety of peripherals, including serial ports, external I/Os, and timers. Peripheral simulation capabilities vary depending on the device selected.
-
Use Target Debugger, like the ULINK ARM
Debugger, links µVision to a debugger adapter, which
interfaces the target system. The following debug devices are
supported:
- JTAG/SW/OCDS Adapter: which connects to on-chip debugging systems like the ARM Embedded ICE.
- Monitor: which can be integrated with user hardware or is available on many evaluation boards.
- Emulator: which connects to the MCU pins of the target hardware.
- In-System Debugger: which is part of the user application program and provides basic test functions.
Third-party tool developers can use the Keil Advanced GDI to interface µVision to their own hardware debuggers.
This chapter includes the sections:
- Using the Debugger is an introduction to simulation and program execution.
- Debug Windows and Dialogs describes the debugging features and interfaces.
- Expressions can be used in debug commands.
- Tips and Tricks describe advanced techniques for a better understanding of the debugger capabilities.
ProductsDevelopment Tools |
Hardware & Collateral |
Downloads |
Support |
Contact |