|
||
| Products Download Events Support Videos | ||

Technical Support
On-Line Manuals
µVision User's Guide


 Performance Analyzer
![]() The Performance Analyzer
shows execution statistics, like time and number of calls of a
function or module.
The Performance Analyzer
shows execution statistics, like time and number of calls of a
function or module.
 Note
Note
- You can use the µVision Simulator to analyze the performance for these architectures. We are not aware that target debuggers can provide the necessary information.
The Performance Analyzer has to be configured using the Setup... button or the PA command in the Command Window. Specify the functions or address ranges for recording data.
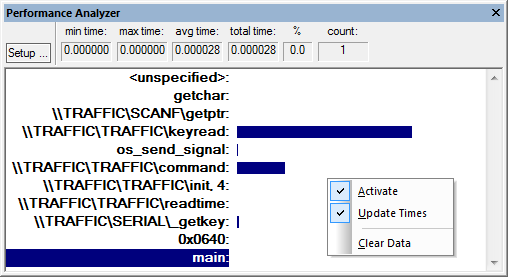
Results are displayed as bar graphs. Statistics, such as invocation count, minimum time, maximum time, and average time, are displayed for the specified function or address range.
The <unspecified> address range is generated automatically. It shows the time spent executing code that is not included in the specified functions or address ranges.
| Label | Description |
|---|---|
| min time | The minimum time spent in the selected address range or function. |
| max time | The maximum time spent in the selected address range or function. |
| avg time | The average time spent in the selected address range or function. |
| total time | The total time spent in the selected address range or function. |
| % | The percent of the total time spent in the selected address range or function. |
| count | The total number of times the selected address range or function was executed. |
ProductsDevelopment Tools |
Hardware & Collateral |
Downloads |
Support |
Contact |