|
||
| Products Download Events Support Videos | ||
ARM Development Tools
ULINK™ Debug Adapters
Evaluation Boards
Resources
- Download MDK-ARM
- Product Manuals
- Getting Started with µVision
- Getting Started with Middleware
- Benefits of using Middleware
- Middleware License
- Knowledgebase Articles
- Supported Devices
Verification Tools
Development Tools by ARM
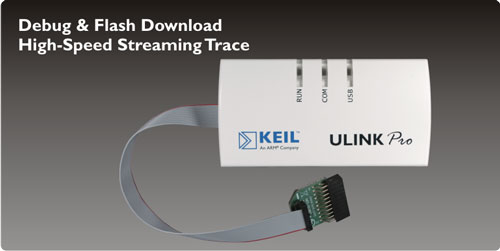
ULINKpro Debug and Trace Unit

The Keil ULINKpro Debug and Trace Unit connects your PC's USB port to your target system (via a JTAG, Cortex Debug, or Cortex Debug+ETM connector). It allows you to program, debug, and analyze your applications using its unique streaming trace technology.
The ULINKpro D Debug Unit has the same high debug performance, but does not support ETM Instruction Trace.
ULINKpro, together with MDK-ARM, provides extended on-the-fly debug capabilities for Cortex-M devices. You are able to control the processor, set breakpoints, and read/write memory contents, all while the processor is running at full speed. High-Speed data and instruction trace are streamed directly to your PC enabling you to analyze detailed program behaviour.
Features
- Supports ARM7, ARM9, Cortex-M0, Cortex-M1, Cortex-M3, and Cortex-M4 devices
- JTAG support for ARM7, ARM9, and Cortex-M
- Serial Wire Debug (SWD) support for Cortex-M
- Serial Wire Viewer (SWV) Data and Event Trace for Cortex-M up to 100Mbit/s (Manchester mode)
- Instruction Trace (ETM) for Cortex-M3 and Cortex-M4 up to 800Mbit/s (not supported with ULINKpro D)
- Unique Streaming Trace direct to your PC, provides unlimited trace buffer
- JTAG Clock Speed up to 50MHz
- Supports Cortex-M devices running at up to 200MHz (Devices may have Trace-Port bandwidth limitations)
- High-Speed Memory Read/Write up to 1MBytes/sec
- Seamless integration with the Keil µVision IDE & Debugger
- Wide target voltage range: 1.2V - 3.3V, 5V tolerant
- Support for 5V only devices using optional 5V Adapter
- Optional Isolation Adapter provides electrical isolation from the target system
- USB 2.0 High-Speed connection
- USB powered (no power supply required)
- Target Connectors
- 10-pin (0.05") - Cortex Debug Connector
- 20-pin (0.10") - ARM Standard JTAG Connector
- 20-pin (0.05") - Cortex Debug+ETM Connector
The unique streaming trace capabilities of ULINKpro delivers sophisticated analysis features such as:
- Complete Code Coverage information about your program's execution ensures thorough application testing and verification
- Performance Analysis using the Execution Profiler and Performance Analyzer enable you to identify program bottlenecks, optimize your application, and to isolate problems
- Streaming instruction trace requires the target device to have ETM (Embedded Trace Macrocell)
Video
 Introduction to ULINKpro
A short video introducing the capabilities of ULINKpro and the sophisticated debug and trace analysis it can deliver.
 Note
Note
- ULINKpro support is available in MDK 4.02 or higher
- ULINKpro D support is available in MDK 4.73 or higher
ProductsDevelopment Tools |
Hardware & Collateral |
Downloads |
Support |
Contact |
