|
||
| Products Download Events Support Videos | ||

Technical Support
On-Line Manuals
ULINKpro User's Guide
Using ULINKpro with PowerScale
ULINKpro and the energy profiling tool PowerScale can be combined to:
- Tune the target system for the lowest possible power configuration.
- Evaluate the best clock frequency for the processor and peripherals.
- Analyze and reduce the overall energy consumption of the application.
Connecting the target hardware to ULINKpro and PowerScale allows analyzing the impact of the user-software on energy consumption. Instructions that consume most of the system's energy can be detected and optimized.
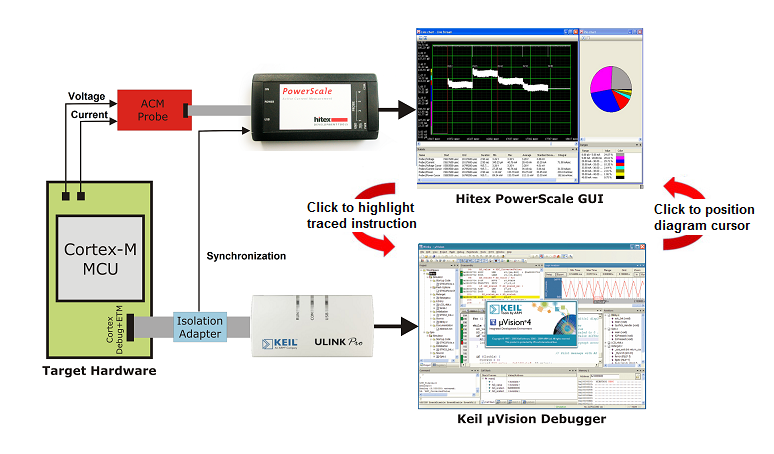
The picture above shows a typical setup, where:
- Keil µVision Debugger windows show the executed and traced instructions. A mouse-click on an instruction displayed in the µVision Instruction Trace window updates the cursor position in the energy diagram of the PowerScale GUI.
- Hitex PowerScale GUI displays voltage-, current-, or energy diagrams. A mouse-click in the PowerScale GUI diagram highlights the corresponding instruction in the µVision Debugger windows.
- ULINKpro delivers debugging and instruction trace information.
- PowerScale and the ACM Probe measure the voltage- and current consumption.
- Isolation Adapter synchronizes the energy measurements with the traced instructions.
Setup the environment
- Connect the Isolation Adapter to the target hardware.
- Connect ULINKpro to the Isolation Adapter and the PC.
- Connect the ACM Probes to the target hardware.
- Connect PowerScale to the ACM Probes, the Isolation Adapter, and the PC.
Configure the environment
Set the following configuration options in µVision:
- Ensure the TPIU TRACECLKIN signal is equal to the core clock.
- Disable Run to main() in the dialog Options for Target - Debug.
- Set the field Reset to HW RESET in the dialog Options for Target - Debug - Settings - Debug. Refer to Debug for details.
-
Enable Unlimited Trace in
the dialog Options for Target - Debug - Settings - Trace and
follow the instructions described in Configure Cortex-M Devices for
Tracing, section Enable 4-Pin Trace (ETM) of the device
in use.
Low power modes powering down the debug domain (trace components) will break the solution.
Note
- This setup requires a high-performance PC, for example with an Intel i7, Quad Core. Refer to test results in PC Performance Requirements.
ProductsDevelopment Tools |
Hardware & Collateral |
Downloads |
Support |
Contact |