|
||
| Products Download Events Support Videos | ||

Technical Support
On-Line Manuals
µVision3 User's Guide
Software Development Cycle
When you use the Keil µVision3, the project development cycle is roughly the same as it is for any other software development project.
- Create a project, select the target chip from the device database, and configure the tool settings.
- Create source files in C or assembly.
- Build your application with the project manager.
- Correct errors in source files.
- Test the linked application.
The following block diagram illustrates the complete µVision3 software development cycle. Each component is described below.
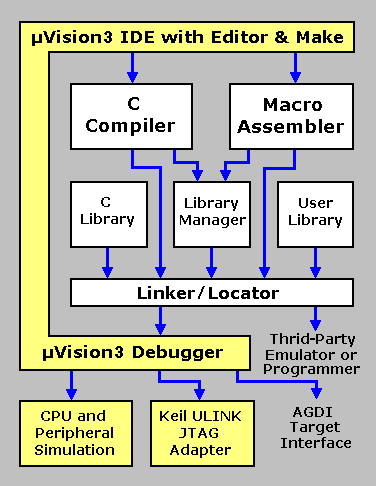
µVision3 IDE
The µVision3 IDE combines project management, a rich-featured editor with interactive error correction, option setup, make facility, and on-line help. Use µVision3 to create your source files and organize them into a project that defines your target application. µVision3 automatically compiles, assembles, and links your embedded application and provides a single focal point for your development efforts.
C Compiler & Macro Assembler
Source files are created by the µVision3 IDE and are passed to the C or EC++ Compiler or Macro Assembler. The compiler and assembler process source files and create relocatable object files.
Library Manager
The library manager allows you to create object library from the object files created by the compiler and assembler. Libraries are specially formatted, ordered program collections of object modules that may be used by the linker at a later time. When the linker processes a library, only those object modules in the library that are necessary to create the program are used.
Linker/Locator
The Linker/Locator creates an executable program file using the object modules extracted from libraries and those created by the compiler and assembler. An executable program file (also called absolute object module) contains no relocatable code or data. All code and data reside at fixed memory locations.
This executable program file may be used:
- To program an Flash ROM or other memory devices,
- With the µVision3 Debugger for simulation and target debugging,
- With an in-circuit emulator for the program testing.
µVision3 Debugger
The µVision3 symbolic, source-level debugger is ideally suited for fast, reliable program debugging. The debugger includes a high-speed simulator that let you simulate an microcontroller system including on-chip peripherals and external hardware. The attributes of the chip you use are automatically configured when you select the device from the Device Database.
The µVision3 Debugger provides several ways for you to test your programs on real target hardware.
- Use the Keil ULINK USB-JTAG adapter for Flash downloading and software test of your program via on-chip debugging system like the Embedded ICE macro cell that is integrated in many ARM devices.
- Use the AGDI interface to attach use the µVision3 Debugger front end with your target system using other debuggers like Monitor, In-System Debugger, or Emulator.
ProductsDevelopment Tools |
Hardware & Collateral |
Downloads |
Support |
Contact |