|
||
| Products Download Events Support Videos | ||

Technical Support
On-Line Manuals
J-Link/J-Trace User's Guide
Debug Settings
To configure the J-Link/J-Trace adapter for debugging:
-
 Open the Options
for Target ... — Debug dialog of µVision.
Open the Options
for Target ... — Debug dialog of µVision.
-
Enable Use and select Cortex-M/R J-LINK/J-Trace.
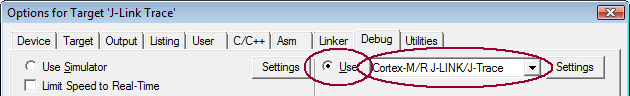
-
Click Settings to open the Target Driver Setup
dialog.
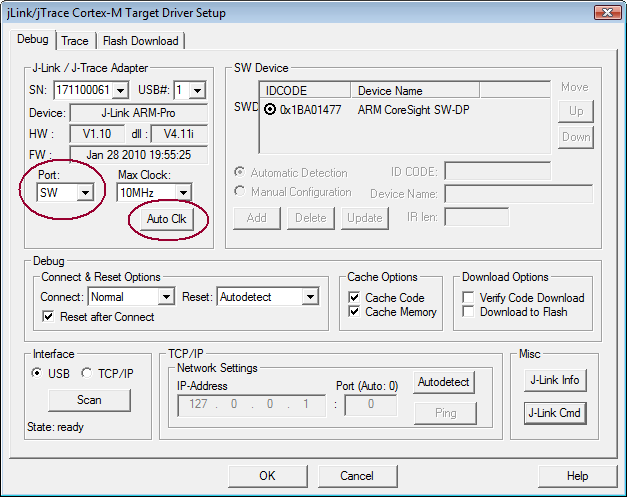
- Select SW (Serial Wire) for the debug Port, and click Auto Clk to set the debugging communication speed.
This screen consists of the following sections:
- J-Link/J-Trace Adapter configures the debugging mode and speed.
- Device Chain displays the device or device-chain detected.
- Debug configures the device behavior during connect, reset, and download.
- Interface and TCP/IP selects the J-Link/J-Trace connection port.
- Misc offers buttons to extract information about the adapter, and to open the J-Link Commander.
ProductsDevelopment Tools |
Hardware & Collateral |
Downloads |
Support |
Contact |