|
||
| Products Download Events Support Videos | ||

Technical Support
On-Line Manuals
CMSIS-DAP Debugger User's Guide


 Enable MTB Trace
To enable Micro Trace Buffer (MTB) instruction tracing for Cortex-M0+/M23 processor-based devices:
- Configure µVision project to capture MTB trace data as described below.
- Make sure that CMSIS-DAP is properly configured in µVision and debug connection to the target is present.
- Restart the debug session and observe the captured trace in µVision Trace Data Window.
 Note
Note
- Due to its intrinsic simplicity, MTB doesn't support advanced, trace-based features available in µVision, such as Performance Analyzer, Execution Profiler, Code Coverage, Logic Analyzer.
- MTB tracing works on all supported debug probes in Serial Wire Debug (SWD) as well as in JTAG Debug modes.
Configure µVision project to capture MTB trace data
µVision uses a debug initialization file that configures and enables the MTB in application projects before the debug session starts. MTB configuration steps described below apply to all supported debug probes.
-
Create a text *.ini file and enter the code that
configures the MTB on the target device.
Many MDK example applications already contain in the root folder a pre-configured initialization file for MTB setup (DBG_MTB.ini).
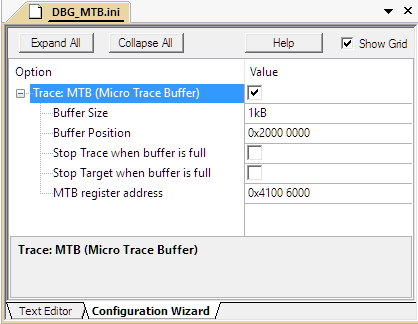
The initialization code is typically annotated for µVision Configuration Wizard support and looks like below:
/******************************************************************************/
/* DBG_MTB.ini: Initialization Script for Cortex-M0+ MTB(Micro Trace Buffer)  */
/******************************************************************************/
// <<< Use Configuration Wizard in Context Menu >>>                           //
/******************************************************************************/

/*-------------------------------------------------------------------
** Define the function to enable the trace port
**-----------------------------------------------------------------*/
FUNC void MTB_Setup (void) {
  unsigned long position;
  unsigned long master;
  unsigned long watermark;
  unsigned long _flow;
  unsigned long positionRegAddr;

// <e0.31> Trace: MTB (Micro Trace Buffer)
//    <o0.0..4> Buffer Size
//      <4=> 256B
//      <5=> 512B
//      <6=> 1kB
//      <7=> 2kB
//      <8=> 4kB
//      <9=> 8kB
//      <i> Trace buffer size in device RAM. MTB memory shall not be used by application.
//   <o1> Buffer Position
//     <i> Starting address of the trace buffer in RAM. MTB memory shall not be used by application.
//   <o2.0> Stop Trace when buffer is full
//   <o2.1> Stop Target when buffer is full
//   <o3> MTB register address
//     <i> Device-specific address of the MTB position register.
// </e>

/* Parameters linked to the Configuration Wizard */
  master     = 0x80000006;
  position   = 0x20000000;
  _flow      = 0x00000000;
  positionRegAddr = 0x41006000;

/* Preparing values for MTB register */
  position  &= 0xFFFFFFF8; // Mask POSITION.POINTER field
  watermark  = position + ((16 << (master & 0x1F)) - 32);
  _flow     |= watermark;

/* Writing values to the MTB registers on the device */
  _WDWORD(positionRegAddr+4, 0x00000000); // Clear MTB MASTER register
  _WDWORD(positionRegAddr, position);     // Write to MTB POSITION register
  _WDWORD(positionRegAddr+8, _flow);      // Write to MTB FLOW register
  _WDWORD(positionRegAddr+4, master);     // Write to MTB MASTER register to enable MTB
}

/*-------------------------------------------------------------------
** Invoke the function at debugger startup
**-----------------------------------------------------------------*/
MTB_Setup();
To adapt this code to a custom application project, open the .ini file in µVision and specify following parameters using Configuration Wizard as shown on the figure below:
-
Trace buffer position and size in device RAM. For proper operation, it is critical to ensure that MTB is located in the RAM area that is not used by the executed firmware.
-
Stop Trace and Stop Target flags when trace buffer is full. As MTB is a circular buffer that gets read only when debug is paused, these flags help to ensure that trace data can be read before it gets overwritten.
-
Device-specific address of the MTB position register according to the device datasheet.
-
-
Open the dialog Options for Target, go to the Debug tab and provide the path to the DBG_MTB.ini file in the Initialization File field.
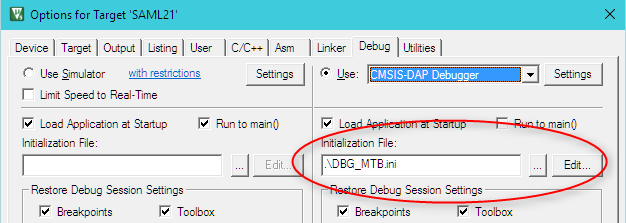
After restarting the debug session the captured trace data can be
now observed in µVision
Trace Data Window.
Note
- See MTB configuration for Cortex-M0+ based NXP MKL25Z devices for platform-specific example.
- Application Note 237 further explores MTB configuration and operation on Cortex-M0+ NXP LPC800 devices.
ProductsDevelopment Tools |
Hardware & Collateral |
Downloads |
Support |
Contact |