|
||
| Products Download Events Support Videos | ||
Technical Support
On-Line Manuals
µVision3 User's Guide
Trace Recording
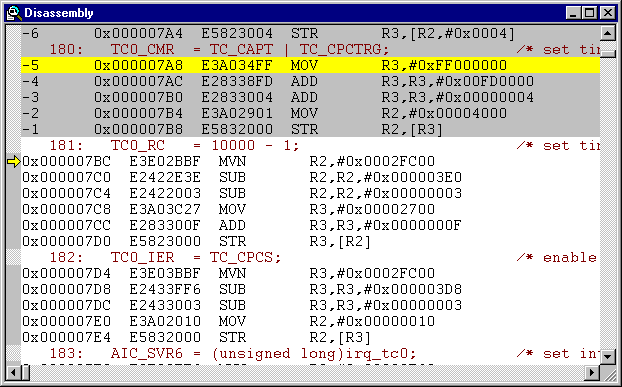
![]() It is common during debugging to reach a
breakpoint where you require information like register values and
other circumstances that led to the breakpoint. If Enable/Disable
Trace Recording is set you can view the CPU instructions that
were executed be reaching the breakpoint.
It is common during debugging to reach a
breakpoint where you require information like register values and
other circumstances that led to the breakpoint. If Enable/Disable
Trace Recording is set you can view the CPU instructions that
were executed be reaching the breakpoint.

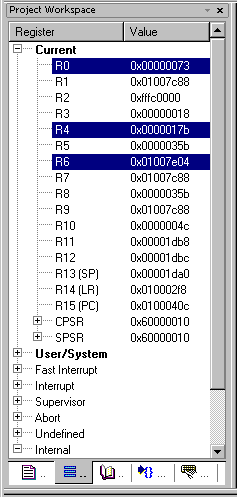
The Regs page of the Project Workspace shows the CPU register contents for the selected instruction.

ProductsDevelopment Tools |
Hardware & Collateral |
Downloads |
Support |
Contact |
